Sustainability
Empowering Sustainability
At Engtek, we are committed to driving meaningful climate action by minimizing our operational emissions through practical solutions and innovative approaches. Our focus is on reducing Scope 1 and 2 emissions, ensuring strict compliance with environmental and safety regulations, and fostering a culture of sustainability across all aspects of our operations.
By prioritizing sustainable practices, we strive to contribute to a cleaner, greener future while upholding our responsibility as a forward-thinking and environmentally conscious organization. Together, we are building a legacy of sustainability that benefits both our business and the planet.
| GRI INDICATOR | METRIC | UNITS | 2024 | 2023 | |
|---|---|---|---|---|---|
| Scope 1 + 2 Emissions | Scope 1 + 2 GHG emissions intensity | tCO2e/Sales $000' | 0.04 | ▼ | 0.05 |
| Scope 1 + 2 GHG emissions intensity from 2023 | % | (9%) | ▼ | - | |
| Scope 1 + 2 GHG emissions total | tCO2e | 22,171 | ▲ | 20,994 | |
| Scope 1 Emissions * | Scope 1 emissions total | tCO2e | 5,761.95 | ▼ | 6,265.58 |
| Scope 1 GHG emissions by natural gas | tCO2e | 3,717.66 | ▲ | 3,233.04 | |
| Scope 1 GHG emissions by LPG | tCO2e | 372.80 | ▲ | 13.17 | |
| Scope 1 GHG emissions by mobile diesel | tCO2e | 107.15 | ▼ | 127.06 | |
| Scope 1 GHG emissions by kerosene | tCO2e | 1,564.35 | ▼ | 2,892.31 | |
| Scope 2 Emissions | Scope 2 emissions total | tCO2e | 16,408.88 | ▲ | 14,728.75 |
| Scope 2 GHG emissions by Electricity use | tCO2e | 16,408.32 | ▲ | 14,728.44 | |
| Scope 2 GHG emissions by Renewal Energy | tCO2e | 0.56 | ▲ | 0.30 | |
| Reduction in Scope 2 GHG emissions by renewable energy / total avoided (%) | % | 0% | = | 0% | |
| Reduction in Scope 2 GHG emissions by renewable energy / total avoided | tCO2e | 3.64 | ▲ | 1.83 | |
| Water Management | Water Consumption | M3/Sales '000 | 0.29 | ▼ | 0.30 |
| M3 | 154,479 | ▲ | 137,265 | ||
| Total Waste Generated | Total manufacturing waste | MT | 2,448 | ▲ | - |
| Total hazardous waste | MT | 954 | ▲ | - | |
| Total non-hazardous waste | MT | 1,494 | ▲ | - | |
| Non-Hazardous Waste Diverted from Disposal | Total non-hazardous manufacturing waste diverted | MT | 363 | ▲ | - |
| Non-hazardous diversion rate % | % | 24% | ▲ | - | |
| Composted | MT | - | - | - | |
| Recycled | MT | 363 | ▲ | - | |
| Reuse | MT | - | - | - | |
| Non-Hazardous Waste Diverted | Total non-hazardous manufacturing waste for disposal | MT | 151 | ▲ | - |
| Incinerated with energy recovery | MT | - | - | - | |
| Incinerated without energy recovery | MT | - | - | - | |
| Landfilled | MT | 43 | ▲ | - | |
| Non-Hazardous Waste Generated by Category | Waste by category (metal) | MT | 991 | ▲ | - |
| Waste by category (wood) | MT | 4 | ▲ | - | |
| Waste by category (plastic) | MT | 19 | ▲ | - | |
| Waste by category (industrial) | MT | 358 | ▲ | - | |
| Waste by category (other) | MT | 96 | ▲ | - | |
| BASELINE : 2023 |
Altum Precision Sdn. Bhd. GHG Emissions Summary
This report presents the inventory of Scope 1, Scope 2, and Scope 3 greenhouse gas emissions, resulting from the activities conducted by Altum Precision Sdn Bhd during the period from 2024-01-01, to 2024-12-31.
This report and associated greenhouse gas inventory adhere to the GHG Protocol Corporate Accounting and Reporting Standard requirements.
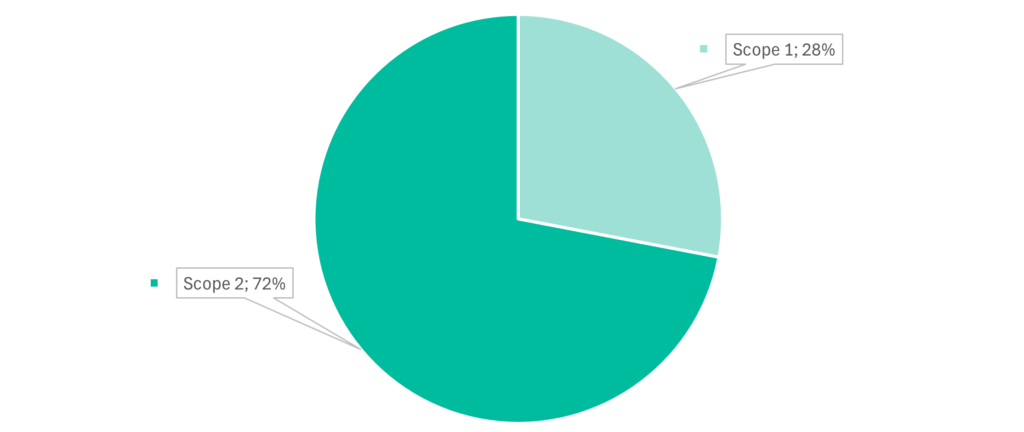
According to the greenhouse gas inventory, Altum Precision Sdn Bhd emitted a total of 4287.187 tons of CO2e between 2024-01-01 and 2024-12-31.
| Scope | Emissions (tCO2e) | Percentage (%) |
|---|---|---|
| 1 | 1200.406 | 28 |
| 2 | 3086.781 | 72 |
-
Scope 1
-
Scope 2


