Emission
Empowering Sustainability
At Engtek, we are committed to driving meaningful climate action by minimizing our operational emissions through practical solutions and innovative approaches. Our focus is on reducing Scope 1 and 2 emissions, ensuring strict compliance with environmental and safety regulations, and fostering a culture of sustainability across all aspects of our operations.
By prioritizing sustainable practices, we strive to contribute to a cleaner, greener future while upholding our responsibility as a forward-thinking and environmentally conscious organization. Together, we are building a legacy of sustainability that benefits both our business and the planet.
| PILLARS | TOPICS | METRIC | UNITS | 2025 | 2024 | |
|---|---|---|---|---|---|---|
| 1. ENVIRONMENTAL | 1. Emissions | GHG Emissions Intensity - Scope 1 + 2 + 3 | tCO2e/Sales RM'000 | N/A | - | N/A |
| GHG Emissions - Scope 1 + 2 + 3 | tCO2e | N/A | - | N/A | ||
| GHG Emissions Intensity - Scope 1 + 2 | tCO2e/Sales RM'000 | 0.04 | ▼ | 0.05 | ||
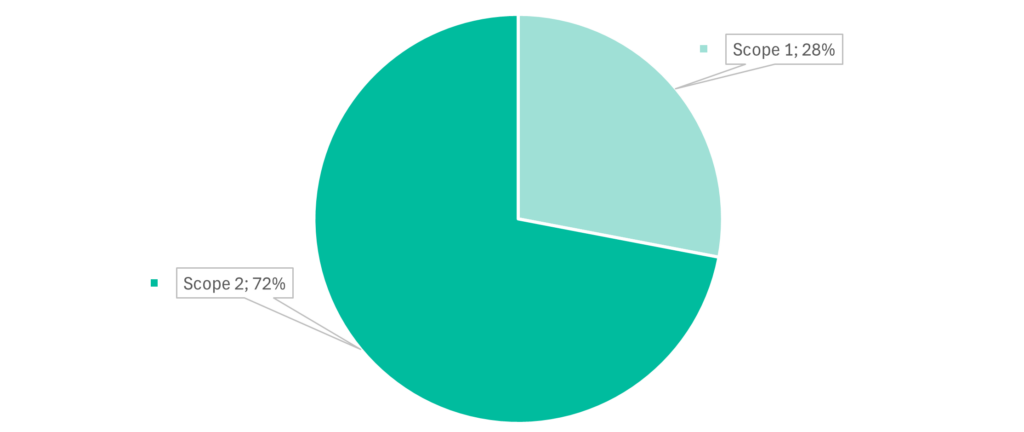
| GHG Emissions - Scope 1 + 2 | tCO2e | 20,246 | ▼ | 21,262 | ||
| - Scope 1 | tCO2e | 6,186 | ▲ | 5,762 | ||
| - Scope 2 | tCO2e | 14,060 | ▼ | 15,500 | ||
| GHG Emission - Scope 3 | tCO2e | N/A | N/A | |||
| 2. Energy | Energy Consumption Intensity | tCO2e/Sales RM'000 | 0.12 | ▲ | 0.11 | |
| - Total Energy Consumption | MWh | 63,892 | ▲ | 56,772 | ||
| - Total Green Energy Consumption | MWh | 10,596 | ▲ | 4,952 | ||
| - % of Green Energy / Total Energy Consumption | % | 17% | ▲ | 9% | ||
| 3. Water | Water Consumption | M3 | 180,134 | ▲ | 147,539 | |
| 4. Waste | Total manufacturing waste | MT | 1,567 | = | 2,448 | |
| - Total hazardous waste | MT | 947 | ▲ | 954 | ||
| - Total non-hazardous waste | MT | 620 | ▼ | 1,494 | ||
| 5. Materials | Responsible Sourcing Policy in place | Yes | - | Yes | ||
| 2. SOCIAL | 6. Human Rights and Labour Standards | Minimum Wage Compliance | % | 100% | - | 100% |
| 7. Employee Management | Total Employees | Number | 2,227 | ▲ | 1,776 | |
| Average Training Hours per Employee | Hours | 8.8 | ▼ | 12.1 | ||
| Employee Turnover Rate | % | 3% | ▼ | 7% | ||
| 8. Diversity, Equity and Inclusion | % of Female Employees | % | 31% | ▼ | 35% | |
| 9. Occupational Health and Safety | Total Recordable Incident Rate (TRIR) | No of recordable incidents per 100 full-time workers per year | 0.46 | ▼ | 0.8 | |
| 10. Community Engagement | Community programs | Number | 2 | - | 2 | |
| 3. GOVERNANCE | 11. Governance Structure | Delegation of Authority Framework in place | Yes | - | Yes | |
| 12. Policy Commitments | Access to Whistleblowing Channel by All Employees | Hours/Days | 24/7 | - | 24/7 | |
| 13. Risk Management and Reporting | Cybersecurity Training Completion Rate | % | 64% | ▲ | 39% | |
| 14. Anti-Corruption | Incident relating to Corruption and or Bribery | Number | 0 | - | 0 | |
| Anti Bribery & Corruption Training Completion Rate | % | 98% | ▲ | 83% | ||
| 15. Customer Privacy | Data Privacy Policy in place | Yes | - | Yes | ||
| BASELINE : 2024 |